
Google Analytics is one of the most ubiquitous tools of web marketing because it provides a lot of web traffic data. So much so that it can leave even the most equipped and experienced marketer feeling a bit overwhelmed.
Fear not! Zoho Reports has a Google Analytics connector that automatically syncs data from Google Analytics and lets you analyze the data, providing you with valuable insights. Here are some of the ways where Zoho Reports makes things easier when it comes to using Google Analytics.
1. Reports for every occasion
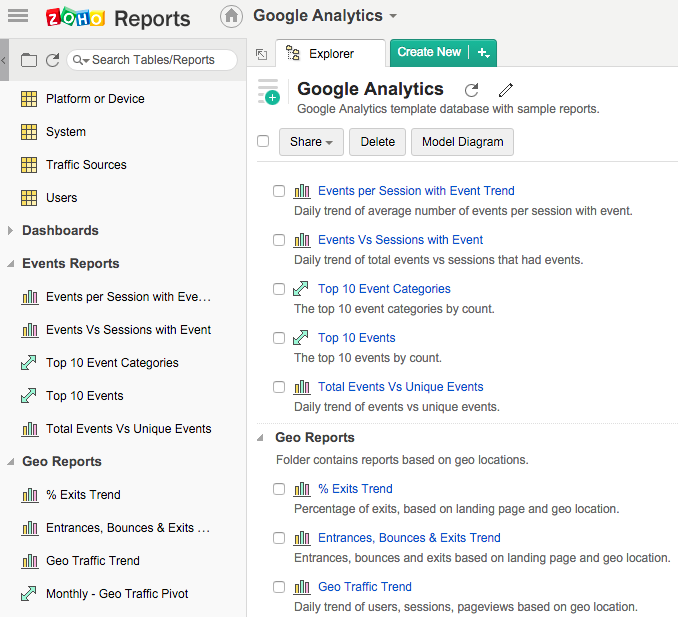
Zoho Reports offers over 50 useful reports for Google Analytics data based on AdWords, Geography, Goals, Network, Platform/Device, System, Users etc. Here’s the sample reporting database.
2. Ad hoc reports
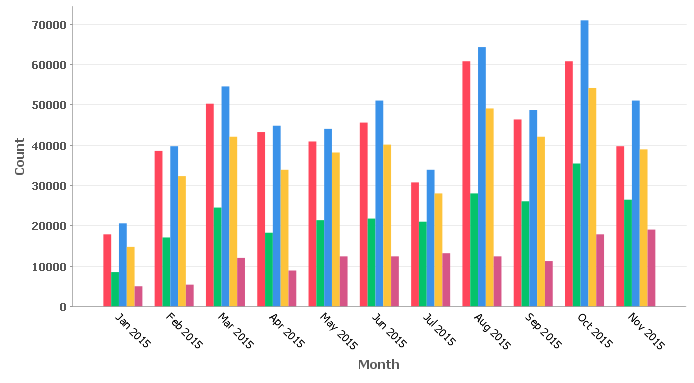
Other than the default set of pre-made reports, you can also create ad hoc reports when you need them. Simply drag and drop any of the table columns and create reports on your own. Let’s look at a couple of Google Analytics reports you can create using Zoho Reports.
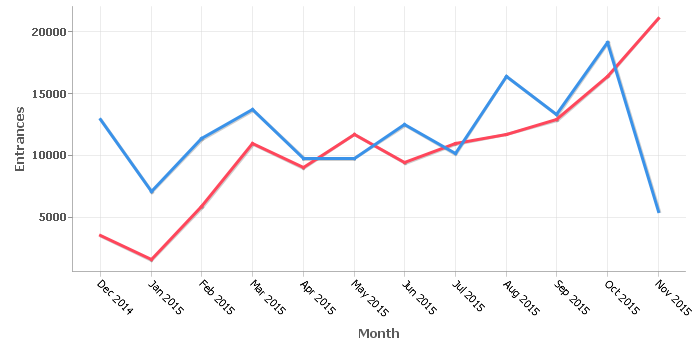
A report comparing how, a few important web traffic metrics have trended over the past few months. (In Google Analytics, you can only compare two metrics at a time)
You can have any number of user-level filters at the top of a report or dashboard. Using such filters help users see trends for a particular set of data. Also, when creating a report, you can define any number of design-level filters too.
3. Dashboards
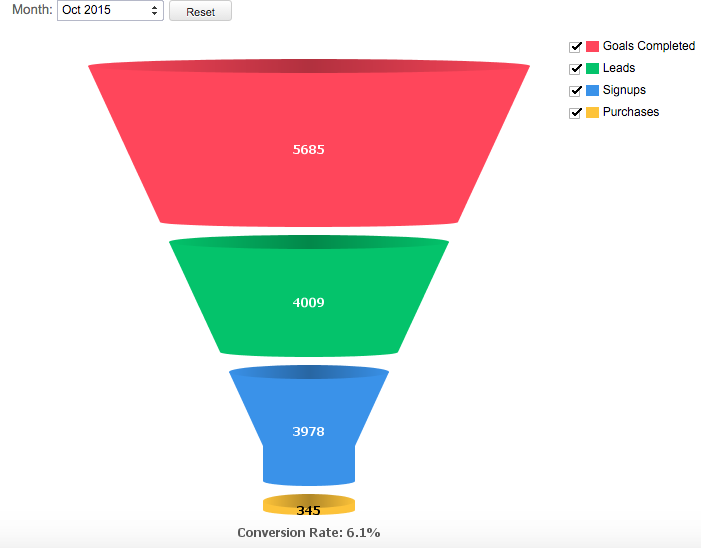
The Zoho Reports add-on for Google Analytics comes with nine default dashboards. Dashboards make it easier to view and track multiple web traffic metrics on a single page. Such dashboards — when displayed on large TV screens — help teams know the latest web traffic stats. Embedded below is a sample AdWords dashboard.
As the above dashboard illustrates, Zoho Reports offers a lot more charting/reporting options to visualize data (pie, bar, stacked bar, area, web, scatter, funnel, pivot table, summary table, KPI metric widgets etc). You can do data drill downs (for example, from year to quarter to month to week to day). And just like ad hoc reports, you can create any number of ad hoc dashboards too.
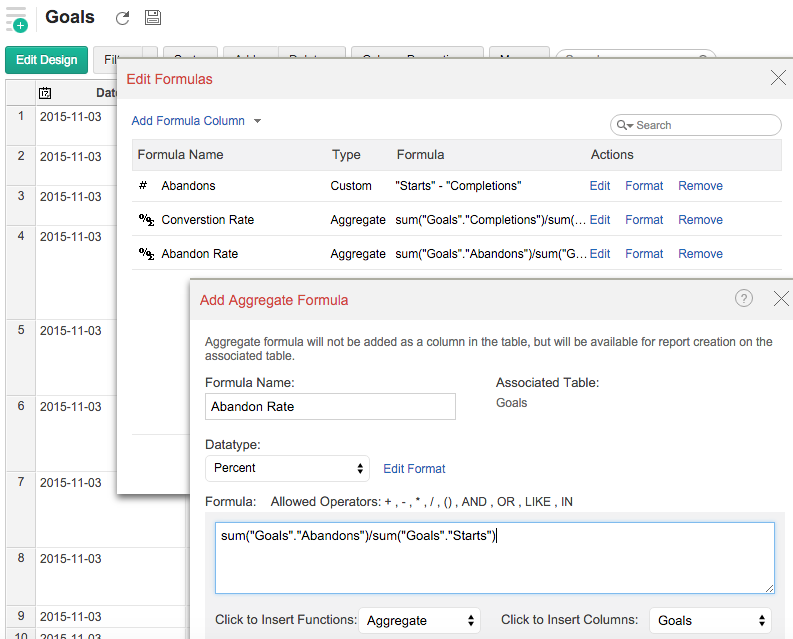
4. Custom metrics
Zoho Reports also allows defining custom or derived metrics through its formula engine. You can define metrics based on multiple base metrics.
5. Cross domain analytics
Using Zoho Reports, you can blend and analyze data from multiple data sources. For example, Google Analytics data can be combined with your CRM data, to know your full lead conversion funnel.
6. Sharing and publishing
Zoho Reports makes sharing and publishing of Google Analytics data and reports much easier. You can share any number of reports with any number of users. And those users can further create their own reports and share them.
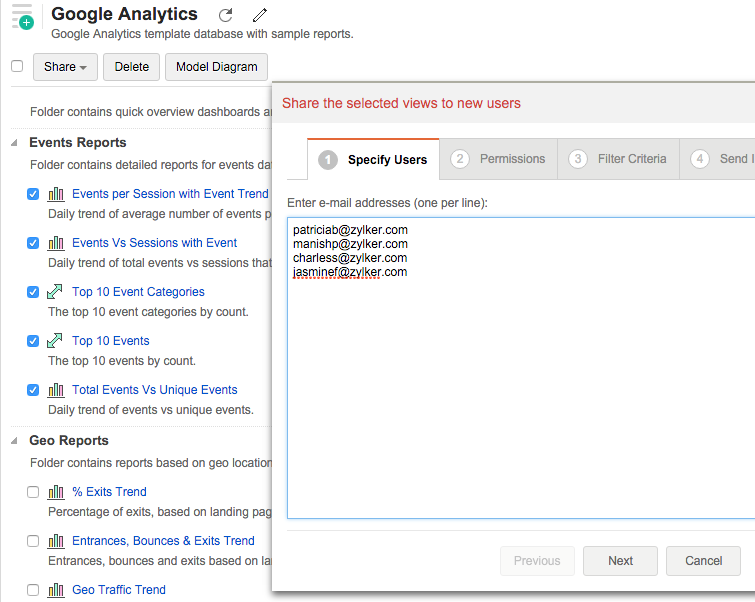
You can specify filter criteria (of what data is to be shown to which user) and view permissions (whether a user can see the underlying data, do a data drill down etc).
You can embed a report or dashboard in a web page, intranet or an app, and use it for wider consumption (like the interactive reports that are embedded in this blog post).
7. Printing and scheduled mailing
Reports can be exported and printed as PDFs for later offline consumption. You can also schedule the Google Analytics reports to be mailed to your clients or colleagues, on a periodic basis.
Those are seven reasons why you should be using Zoho Reports to analyze Google Analytics data. Know more about Zoho Reports for Google Analytics, and try it out for free by signing up for our 15-day free trial.